L&T: India's biggest builder, explained
L&T is very good at winning work and much less good at turning it into rising margins. And the stock already prices in a smooth future.
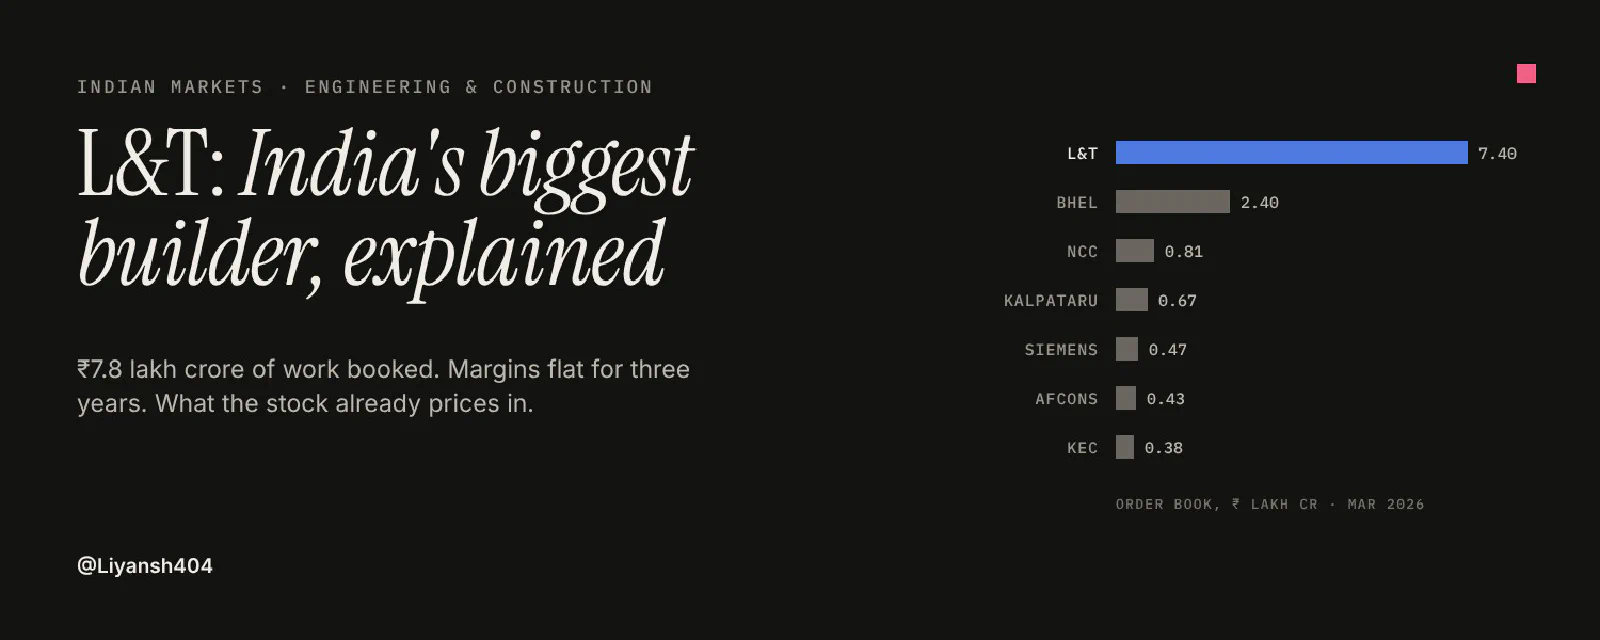
Imagine a company that has already been hired to build ₹7.8 lakh crore of projects. That is more work than its next six Indian rivals have combined. It builds metros, refineries, offshore platforms, power lines, nuclear parts and submarines. Yet its stock has returned only about 6% a year for three years.
The short answer: L&T is very good at winning work. It is much less good at turning that work into rising profit margins. And the stock already prices in a smooth future.
The industry in two minutes
L&T is an EPC company: engineering, procurement and construction. A client (a government, an oil company, a factory owner) decides to build something. L&T designs it, buys the steel and equipment, builds it and hands over the keys. So L&T grows when someone else decides to spend on assets.
Three customers matter most:
- The Indian government funded the last boom.
- Indian private companies are now the growth driver.
- Gulf oil and gas companies are the biggest overseas client group.
1. Indian government: the boom is pausing. Central capex tripled from FY20 to FY25, then grew only 1.6% in FY26.
FY27 started strong: April–August spending was up 18%. But August alone fell about 30% (Jefferies), and the same pattern ended flat last year. Roads (NHAI awards down 22% in FY26) and water (₹50,000 Cr of Jal Jeevan Mission funds unspent) are the weak spots. Rating agency ICRA expects Indian EPC companies’ revenue to grow only 6–8% in FY27.
2. Indian private capex: the new engine. Announced private projects from April to early August 2026 were worth ₹26.75 lakh Cr, and 56% of that was data centres and AI (Bank of Baroda). India’s data-centre capacity is about 1.6–1.8 GW today; forecasts for 2029–30 range from 4 to 8 GW. Power is the other big one:
- Transmission: a ₹9.16 lakh Cr national plan to 2032.
- Coal power: 97 GW of new capacity needed by FY35, in effect a two-bidder market (BHEL and L&T).
- Nuclear: 8.8 GW today to about 22 GW by FY32, newly opened to private players by the SHANTI Act.
3. Gulf oil and gas: a split market. Gulf project awards fell 32% in 2025 to about $213 bn, and Q3 2026 ($47.4 bn) was the weakest quarter on record (Kamco, MEED). But gas project awards rose about 60% in the first nine months of 2026. The slump is in giga-projects and Saudi power, not oil and gas, which is L&T’s niche there.
What this means for L&T: the old engine (Indian government roads and water) is slowing. The new engines (private power, data centres, Gulf gas, European offshore wind) are bigger but more cyclical.
How L&T makes money
Think of L&T as a general contractor for a house, multiplied by a million. The client pays an advance, then pays monthly as walls go up, and keeps a little back until the roof doesn’t leak. The contractor earns a thin slice in between. If steel prices jump on a fixed-price job, that slice can vanish.
This is why L&T can earn a mid-teens return on equity on a thin margin: clients’ money, not L&T’s, funds most of the work. It also explains the biggest risk. About half the order book is fixed-price, so when costs jump (as on Gulf oil and gas jobs in FY26) L&T absorbs it.
The construction businesses bring in about two-thirds of revenue at about 7% EBITDA margin. The high-margin parts are smaller:
- Listed subsidiaries: IT services (LTM and LTTS, 19%) and L&T Finance (25%).
- Defence and nuclear manufacturing: 18%.
- Realty: 49%.
The investment case is mostly about the 7% businesses getting bigger without getting worse.
88 years in one picture
This history explains two things about L&T today. First, it has no promoter: no family or group whose own money rides on every decision. Professional managers run it, shielded by the employees’ trust and LIC. Second, it has a habit of buying and selling whole businesses (cement, electrical, Mindtree, roads, power plants) when it thinks the value is better elsewhere.
The moat: size you can’t copy, prices you can’t control
L&T’s moat is the ability to take on jobs nobody else in India can. A ₹15,000 Cr offshore platform needs a balance sheet that can carry bank guarantees, yards that can fabricate giant offshore modules, and a track record that Gulf oil companies will pre-qualify. Very few firms have all three.
| Strength | Evidence |
|---|---|
| Scale | Order book of ₹7.4 lakh Cr (Mar 2026), more than the next six Indian rivals combined |
| Balance sheet | Rated AAA by CRISIL; about ₹1.25 lakh Cr of guarantee-type bank limits |
| Own yards and factories | Fabrication yards at Hazira, Kattupalli and Sohar (Oman); heavy engineering for nuclear and defence |
| Hard-to-get approvals | Pre-qualified with Gulf state oil companies, defence and nuclear. In nuclear EPC its only Indian rival is BHEL; in coal power it is one of two bidders |
| People | About 4.4 lakh workforce (standalone), of whom about 3.8 lakh are contract workers |
Where the moat is thin: price. In Indian infrastructure, where many contractors bid, L&T’s margin fell from 8.2% (FY22) to 6.9% (FY26) and 5.1% in Q1 FY27. Its 7.8% core margin is no higher than global peers like Technip Energies (7.2%) or Samsung E&A (8.8%). The moat protects volume, not pricing power.
Where the work is
The book is now more foreign than Indian, and the Middle East is the single biggest piece.
The book is also growing faster than L&T can execute it. Work booked now equals 2.7 years of revenue, up from 2.1 two years ago.
That is good news delayed, not good news lost. L&T earns when it builds, not when it wins. Three things to know:
- The jobs are getting longer. More of the book is 4–5 year offshore wind and offshore oil and gas work.
- Q2 wins were strong. From 20 Jul to 17 Aug, L&T announced 10 orders worth at least ₹92,500 Cr. They include ADNOC Offshore (UAE), a second Gulf offshore job, Kuwait Oil Company, ONGC and TenneT offshore wind platforms (Netherlands).
- The pipeline is not. Prospects for Jul 2026–Mar 2027 are ₹15.07 lakh Cr, only 1.8% more than a year ago.
Management: what they said vs what happened
We read the full transcripts of nine earnings calls, from Q1 FY25 (Jul 2024) to Q1 FY27 (Jul 2026). We also read 21 interviews and speeches by L&T leaders from 2025–26. The pattern is clear.
How to read L&T’s guidance: order-inflow and working-capital targets are set low and beaten every year, so a beat proves little. Revenue, margin and dated milestones are the targets that move earnings, and those slip. A reaffirmation late in the year (“reasonably confident”) should be discounted.
What the calls and interviews reveal:
- The oil and gas story changed every call. FY25 calls blamed “stage of execution” while Energy margin slid from 8.7% to 8.1%. No FY25 call disclosed an overrun. In FY26 “cost overruns” appeared, recovery was promised “in 2–3 quarters”, then moved again.
- Fixed-price exposure crept up quietly: 42% of the book (Mar 2024), 46% (Mar 2025), 55% (Dec 2025), about 50% (Jun 2026).
- Gulf comments ran ahead of the numbers. In March 2026 Deputy MD Subramanian Sarma said 95% of Gulf sites were “business as usual”. Q4 FY26 then lost about ₹5,000 Cr of revenue to the war.
- Ambitions are growing faster than delivery.
- Data centres: targets went from about 100 MW to 250–400 MW to “gigawatt-scale”, while about 30 MW is live.
- L&T Semiconductor: the revenue goal fell from “$1 bn visibility” to “$500 m before IPO”.
- Credit where due: order wins, the Nabha sale, the Panipat green hydrogen award and the Q2 pick-up in Gulf awards all arrived as promised.
People and pay:
- Succession. CMD S.N. Subrahmanyan’s term ends on 30 Jun 2027 and no successor has been named. Deputy MD Sarma, whose term runs to Feb 2028, is the visible internal candidate. SNS took the same path in 2015–17.
- Pay. CMD pay was reported at ₹120.84 Cr for FY26, up 59% and 1,016 times the median employee, in a year when the revenue, margin and ROE targets were missed (single source).
Financials: good books, but last year’s cash won’t repeat
The accounts are clean. Three things in them matter for the next two years.
1. The cash tailwind is reversing. In FY26, big customer advances cut working capital to 4% of revenue, releasing about ₹15,000 Cr. Management itself guides it back to about 10%.
2. The core margin has not moved. The construction and manufacturing margin was 8.2% in FY24, 8.3% in FY25 and 8.3% in FY26 (old basis), and 7.8% on the new basis in both FY25 and FY26. FY27 guidance is about 7.8%, and Q1 came in at 7.0%. Revenue grows; the slice per rupee doesn’t.
3. Treasury income is carrying profit growth. Other income was about 21% of pre-tax profit in FY26 and 34% in Q1 FY27, when it rose 75%. Q1 EBITDA actually fell 3%. The CFO said it would be “unfair” to call this “the new norm”. It will also shrink as cash goes into the new businesses.
Return on equity rose from 12.2% (FY23) to 16.3% (FY25), mostly because revenue grew 39% while assets grew 15%. Clients’ advances funded the difference. It was 15.5% in FY26 (16.6% before a one-off labour-code charge), against an 18% target. The new target is lower: 16–17%.
Forensic flags (moderate):
- Hyderabad Metro: a ₹6,013 Cr write-down in L&T’s standalone accounts, but none at group level.
- Overdue loan: ₹1,587 Cr owed by a subsidiary has been overdue since 2022.
- Auditor change: Deloitte left as joint auditor after FY25.
- Tax rate: rose from 24% to 28%, with no explanation given.
None is alarming. All are worth watching.
Second-order: advances, treasury income and earnings are tied together. If new orders slow, advances shrink, working capital rises and the cash pile falls. Treasury income then drops, all at once.
Competitors: L&T is bigger, not more profitable
L&T’s core margin sits in the middle of the pack, at home and abroad. What sets it apart is size and breadth. Many rivals are weakening: Petrofac collapsed into administration in Oct 2025, Tata Projects lost money, and Technip and Saipem took Middle East war costs too.
| Company | Revenue (latest year) | Margin | Order book ÷ revenue | Note |
|---|---|---|---|---|
| L&T core projects | ₹2.07 lakh Cr (FY26) | 7.8% EBITDA | 3.5x | Widest range: infra, oil and gas, power, defence, offshore wind |
| BHEL | ₹33,782 Cr (FY26) | 7.6% | 7.1x | Only rival in coal power and nuclear EPC |
| Kalpataru Projects | ₹27,143 Cr (FY26) | 9.0% | 2.5x | Stopped bidding domestic water work |
| KEC International | ₹23,506 Cr (FY26) | 8.0% | 1.6x | Power transmission; margin down 120 bp |
| NCC | ₹20,823 Cr (FY26) | 8.8% | 3.9x | Withdrew guidance |
| Tata Projects | ₹16,540 Cr (FY26) | 0.2% | — | Lost ₹891 Cr in FY26 |
| Afcons | ₹11,948 Cr (FY26) | 10.4% | 3.6x | Revenue down 20%; margin down 340 bp |
| Samsung E&A (Korea) | KRW 9.0 trn (2025) | 8.8% operating | 2.0x | Gulf gas rival |
| Technip Energies (France) | €7.2 bn (2025) | 7.2% EBIT | 2.2x | Project margin hit to 4.3% by war costs |
| Saipem (Italy) | €15.5 bn (2025) | 11.1% adj. EBITDA | 2.0x | Offshore rival; absorbed ~€70 m of Gulf costs |
| Hyundai E&C (Korea) | KRW 31.1 trn (2025) | 2.1% operating | 3.1x |
Margin definitions differ across companies; treat them as rough guides. Indian figures are from Screener.in and company releases. In European offshore wind platforms, L&T holds 4 firm contracts (plus 2 in principle) of about 19 large platforms identified; the rest sit with Seatrium, Dragados, McDermott and Smulders.
Valuation: what are you paying for?
Step 1: separate the two companies inside L&T. About a third of L&T’s market value is its stakes in three listed companies. Take those out and the engineering business is not cheap.
Step 2: why the stock went nowhere. Profit grew; the multiple shrank. Over three years EPS rose about 35% while the P/E fell about 12%, so the price rose only about 19%. Since the February 2026 peak, the entire 18% fall is de-rating.
Step 3: bear, base and bull. Three simple cases for around mid-2028:
| Case | What has to happen | FY28 EPS | P/E |
|---|---|---|---|
| Bear | Gulf costs stick, working capital goes back to 10%, treasury income falls, rates stay high | ₹140 (about 6% a year from FY26’s ₹125 recurring) | 22x, below the 10-year median |
| Base | Execution recovers in H2 FY27; revenue grows 12–14% a year at ~7.8% core margin | ₹163 (about 10% below consensus) | 26x, the 10-year median |
| Bull | Consensus is delivered; Gulf ceasefire; rates peak | ₹180 (consensus) | 30x, today’s multiple |
What is priced in today: a reverse DCF at a 13% cost of equity needs 20–24% EPS growth a year for 10–15 years to justify ₹3,653. Put the other way, the market is using a cost of equity near 10%. That is why rate moves hit this stock harder than its earnings do.
The street is more bullish than this analysis: 13 of 14 brokers with a 2026 view say Buy. The 29-analyst average target is ₹4,502. Their FY27 earnings estimate needs about 32% profit growth in the last three quarters after a 14% Q1.
Risks: what could go wrong
- Gulf execution. 37% of the book is in the Middle East, about half the book is fixed-price, and the Strait of Hormuz is still disrupted. The IMF expects Qatar’s and Kuwait’s economies to shrink about 16–17% in 2026, before a rebound in 2027. Management books extra-cost recovery only once clients agree.
- Earnings cuts. Consensus needs about 32% profit growth for the rest of FY27; the revenue guide needs 11–13.5% growth.
- Rates. The stock is priced as if money costs about 10%. The RBI raised rates on 7 Oct 2026 and US 10-year yields are above 5.2%.
- Working capital. Guided back to about 10% of revenue, absorbing about a year of operating cash flow.
- Weak rupee: probably helps rather than hurts, since 52% of the book is international.
Conclusion
L&T is a rare business: the one Indian company that can build almost anything, almost anywhere, at almost any size. That is why its order book keeps growing faster than anyone expects. But being the biggest builder has not made it a better-paid builder. Margins have been flat for three years, and the stock has spent those three years shedding a premium it earned in 2024.
At ₹3,653 the question is not “is L&T a great company?” It is “will the next 18 months go smoothly enough to justify 30x?” Four things make that hard: the Gulf war, a working-capital reversal, a high-rate world, and consensus numbers that already assume a strong second half.
In one line: a great franchise, priced for a smoother year than the one it is having.
What to track
Q2 FY27 results on 27 Oct 2026:
- Revenue guidance. Is 10–12% kept, cut, or kept with a warning?
- Core margin. Below 7.5% is a warning sign; 7.8% or above would mean Q1’s dip was one-off provisions.
- Working capital. Above 8% of revenue means the cash tailwind is unwinding fast.
- Gulf. Energy margin, and any extra costs clients agree to pay.
- Quality of profit. How much growth comes from operations vs treasury income.
- Capex plan. The Lakshya 2031 capex detail promised “in Q2”.
Over the next year:
- Hyderabad Metro sale closes by 31 Dec 2026
- Successor named before the CMD’s term ends on 30 Jun 2027
- Strait of Hormuz reopens (IMF assumes from Mar 2027)
- Central capex pace in H2 FY27 (monthly CGA data)
- First large nuclear order under the SHANTI Act
- Realty listing timeline
How this was researched
- Earnings calls: full transcripts of nine calls (Q1 FY25–Q1 FY27) from L&T’s investor site, plus the Lakshya 2031 presentation.
- Management: 21 interviews, speeches and letters from 2025–26. TV interviews were not available as transcripts.
- Industry: reports and data from CRISIL, ICRA, India Ratings, PRS, CGA, CEA, JLL, CBRE, Savills, Colliers, Kamco, MEED, the IMF and the IEA.
- Brokers and financials: 14 broker notes, MarketScreener consensus and Screener.in financials.
- Checking: independent fact-checkers re-checked the key numbers.
Data as of 19 Oct 2026. Market figures move daily. This is research, not a recommendation to buy or sell; do your own research.