Indian medical devices: what India makes, and what's priced in
India makes the disposables, assembles the middle and imports the top. The margins sit with makers and hospitals, and the one scaled listed pure-play, Poly Medicure, is priced for its best case.
The 60-second view
India’s medical-device story is a real import-substitution story, but it sits mostly in plastic and steel disposables and mid-technology assembly, the margin pools are at the maker and the hospital, and the only scaled listed pure-play, Poly Medicure, is priced for its best case.
It is written as an investment-committee memo: what must be true, what is priced in, and what would prove it wrong.
| Question | Short answer |
|---|---|
| Where do the margins lie? | Makers whose products need approvals and clinical evidence earn 24% to 28% EBITDA (Poly); importers and distributors earn about 4% to 10%; hospital billing carries the widest mark-ups, up to about 29x purchase price on consumables |
| What drives the next phase? | Import substitution (domestic share of local demand from about 10% to about 30% in five years), hospital capacity (about 38,000 private beds by 2030), Tier II-III demand and exports. Growth reaches profit only where the product moves up: Poly’s FY26 sales grew 12% while net profit fell 5% |
| How do Indian and global players compare? | Indian makers win on cost and bought capability in mid-complexity categories; R&D is 1.6% of sales at Poly against a 7.3% global median, and the largest listed maker is about 1/165th of Medtronic |
| What can India make? | Moulded, extruded and assembled disposables competitively; stents, dialysers and imaging only with imported critical inputs; local content is about 30% |
| Which listed names track it? | Poly Medicure is the only scaled, liquid pure-play; the rest are small caps, SME listings or mixed models, with trailing P/Es from 22x to 135x |
| What can break it? | Price first (trade-margin caps, Chinese dumping, tariffs, de-rating), then the thin component base |
| What is priced in? | At Rs 1,444 Poly needs about 35% revenue growth to FY30 or a 9.1% discount rate on my base case; a 12% annual return needs about 16% EPS growth and a 40x exit P/E; the sum of the parts gives Rs 1,351 (range Rs 1,084 to Rs 1,629) |
What India can and cannot make explains most of the rest. It makes IV sets, cannulas, syringes, needles, blood bags, gloves and labware competitively, because the value sits in tooling, automated lines and sterile supply chains rather than in the polymer. It assembles stents, dialysers, ultrasound and X-ray systems, but imports what sits underneath: medical-grade resins, specialty alloys, membranes, X-ray tubes and detectors, sensors, semiconductors and magnets. Imports were about $8.8 billion against $4 billion of exports in FY25. The second-order consequence is that the listed winners today are the integrated assemblers, not the suppliers beneath them, and that in my reading a margin cap on the channel would reach makers last.
The committee question is therefore two questions. Is the sector worth owning? The runway for import substitution says yes, and the policy and demand drivers back it. Is the stock worth its price? For Poly the price leaves no cushion: it asks for roughly twice the growth I would underwrite, or a margin double today’s, and it gives little visible discount to the policy, tariff and dumping risks listed above. The kill criteria for the sector thesis and for the Poly case are in the final section.
Products and how they are made
Indian makers are strongest where a product is moulded, extruded or assembled from imported plastic and steel inputs, and weakest where it needs a membrane, a precision sensor, a magnet or a specialty chemical.
| Product family | How it is made | Inputs that are hard to localise | What India does well | Listed names |
|---|---|---|---|---|
| Infusion: IV sets, cannulas, connectors | Injection-moulded spike, drip chamber and Luer connector; extruded PVC tubing (about 150 cm) cut and solvent-bonded; roller clamp and Y-site fitted; cannula = steel needle plus polymer catheter plus safety clip; automated assembly, cleanroom, ethylene-oxide (EO) sterilisation in peel pouch to ISO 8536-4 | Medical-grade PVC, polypropylene and film (Poly imports an estimated 60-70% of raw materials, from Korea, Malaysia, Taiwan, Japan, China and Europe); the filter media; precision moulds | Tool-room and mould design, high-speed assembly lines, patents (Poly: 340+ granted; about 10% of the global IV cannula market) | Poly Medicure |
| Syringes and needles | Polypropylene barrel and plunger moulded; rubber tip fitted; needle cut from stainless-steel tube, ground to a 3-facet point, siliconised, hub-bonded; vision-checked and sterilised | Rubber (plunger tip) and steel tube quality; China sets the price floor | Hindustan Syringes makes needles from cold-rolled steel strip on Japanese technology with fully automated lines | Unlisted (Hindustan Syringes) |
| Blood bags and transfusion | PVC film extruded, bags radio-frequency welded with tubing, filled with anticoagulant solution (CPDA), sterilised | Medical-grade PVC film, plasticiser, anticoagulant solution quality | Cost position and Indian blood-bank demand | Poly Medicure |
| Renal: dialysers, bloodlines, fistula needles, machines | Hollow-fibre membrane is spun, bundled, potted into a housing, sterilised; bloodlines are tubing sets; machines are electronics plus pumps | The membrane and machine electronics; Indian efforts to make an indigenous hollow-fibre membrane are still at animal-trial stage; most dialysis instruments and consumables used in India are imported | Poly calls itself the first indigenous dialyser maker (assembled machines priced 5-7% below multinationals, per a 2023 broker note) | Poly Medicure |
| Cardiology: stents, balloons, TAVI | Cobalt-chromium tube laser-cut, polished, crimped on a balloon catheter, coated with a drug (sirolimus) in a polymer, sterilised; TAVI valves are tissue plus a metal frame | SMT imported 77% of FY26 purchases by value; some components come from a single supplier | Drug-eluting stents: SMT holds nearly 25% of India’s volume, with plants in Surat, Hyderabad and Thailand | SMT |
| Orthopaedic implants | Cast or forged cobalt-chromium, titanium or steel, CNC-machined (Swiss-type turning, multi-axis milling), polished, sterilised | Medical-grade alloys, precision tooling, instrument sets | Knee and trauma implants at prices the 2017 cap forced down: CoCr knee ceiling Rs 54,720 against an earlier average MRP of Rs 1,58,324 | Poly (Citieffe, Italy); unlisted Meril |
| Diagnostics: molecular kits and analysers | Cartridge or chip moulded, reagents dried onto it, packed with a portable analyser | Specialist reagents (enzymes, antibodies), optics, chips; diagnostic reagents were 77.5% imported in the government task force’s 2013-14 data | Point-of-care PCR (Truenat), TB and infectious-disease kits | Molbio, Q-Line |
| Imaging: X-ray, CT, MRI, ultrasound | Assembly and calibration of imported tubes, detectors, probes, magnets and electronics; software and enclosures made locally | X-ray tubes, flat-panel detectors, ultrasound probes, magnets, semiconductors; value-add is only 40-50% | Wipro GE ultrasound (Bengaluru); Fischer’s MRI, made at AMTZ and described as India’s first indigenous system; Panacea’s linear accelerator | Fischer |
Sources: Medikabazaar (infusion-set anatomy), HDFC Securities initiation on Poly Medicure, May 2023 (raw-material imports, patents, dialysers; FY22-23 data), HMD needle brochure, SMT summary (FY26 purchases, market share), IIT hollow-fibre work, knee-implant cap, Aug 2017, Department of Pharmaceuticals task force, Business Today, Aug 2026, Fischer MRI. The process descriptions are general industry practice, not company-specific disclosures; where I could not find an import share (medical-grade resins, hypodermic tube, membranes) I say so rather than estimate.
Two things to take from this table. First, the moat in disposables is not the polymer: it is the mould tool room, the automated line and the sterile, regulated supply chain, which is why a 340-patent maker earns 24% to 28% EBITDA while commodity syringe lines compete on price. Second, the same table shows where margins are capped: whoever supplies the resin, the membrane or the tube sets the cost floor, and in India that supplier is usually foreign.
India’s manufacturing capability map
India is a competitive maker of plastic and steel disposables, an assembler of most mid-technology devices, and a net importer of the components, membranes, sensors and magnets that sit underneath them: imports were about $8.8 billion against $4 billion of exports in FY25, and local content is only about 30%.
| Tier | What India does | Examples | Why the line sits there |
|---|---|---|---|
| 1. Makes competitively, from imported polymer and steel | Moulding, extrusion, automated assembly, EO sterilisation | IV sets, cannulas, syringes, needles, blood bags, gloves, labware, basic dental products | Low capital per unit, volume learning curve, mould and tool-room skill; Chinese and ASEAN prices set the ceiling |
| 2. Makes the device, imports the critical input | Final assembly, coating, calibration, regulatory file | Stents (SMT imported 77% of FY26 purchases), dialysers (membrane), ultrasound and X-ray systems (tubes, detectors, probes), monitors (sensors and chips), analysers (optics, reagents) | The input needs microfabrication, polymer chemistry or biochemistry that few Indian suppliers have; assembly captures only 30-40% of product value |
| 3. Mostly imports | Distribution and service | Advanced MRI and CT, robotic surgery, advanced endoscopes, pacemakers, continuous glucose monitors, high-end diagnostic analysers | R&D of 7 to 10 years, aerospace-grade precision, clinical-evidence base, hospital brand preference; the government has listed MRI, CT and X-ray components, advanced ultrasound, pacemakers, CGM, ICU beds and high-end analysers for localisation review |
| Components under all tiers | Little | Medical-grade resins, specialty alloys, precision motors, sensors, semiconductors, validated reagents | Supplier depth is shallow; duties on sub-assemblies can exceed duties on finished goods, so importing a whole system is sometimes cheaper than sourcing modules locally |
Sources: Business Today, Aug 2026, India Briefing, GrowthJockey: supply-chain tiers, GrowthJockey: import addiction, SMT summary. Tier placement of individual products is my synthesis of these sources; none gives a product-by-product import share.
What shapes the map:
- Concentrated import bill: imports span about 6,000 devices across 160 HS codes, and 40 codes account for roughly 85% of the bill. Localising a few dozen products would move the total.
- Cost structure works against assemblers: most devices carry 5% GST while many inputs and job work carry 18%; ASEAN goods enter at zero tariff and Chinese product is alleged to be routed through Malaysia and Vietnam; public tenders often pick the lowest bid.
- Policy is real but small against the gap: the PLI scheme covers 55 high-end devices with a 5% incentive on incremental sales for a five-year performance period (FY23 to FY27); 28 of 77 applications were approved and 22 projects have started, with Rs 12,344 cr of sales and Rs 5,869 cr of exports reported. Medical device parks add shared testing, calibration and EO sterilisation; reported counts differ (four operating parks in one source, nine named sites in another, including AMTZ at Visakhapatnam, Telangana, Oragadam in Tamil Nadu, Kerala, and the UP park near Noida).
- Government targets: import dependence below 40% and output of $30 billion by 2030 (cited by GrowthJockey); these are aims, not forecasts.
- The second-order point: a component maker needs volume to justify the capital, and that volume exists only if many assemblers buy locally; the reverse is also true. That is why clusters and procurement preference matter more than a single plant, and why the listed winners are today the integrated assemblers rather than the suppliers beneath them.
The value chain and where the margins lie
Margin follows scarcity: it sits with makers whose products need approvals and clinical evidence and with hospital billing, while the importer or distributor in between earns a thin 4% to 10%.
Start at the left. Components are the one stage where this note has no sourced margin, but it does have the dependence: Poly Medicure imported 60% to 70% of its raw materials in FY22-23 and SMT’s imports were 77% of its FY26 purchases, so part of the manufacturing margin is spent abroad before the product exists. At the manufacturer, margin tracks how hard the product is to copy. A maker of IV sets or syringes sells into a crowded field with little clinical lock-in; a maker of stents, cardiology devices or dialysers needs approvals and clinical evidence, which is what supports Poly’s 24% to 28% EBITDA and Medtronic’s 24.4% operating margin. Geography matters too: a 2023 HDFC Securities note put Poly’s domestic EBITDA margin at 18% to 20% against about 30% on exports. That is one older source I could not refresh, so read it as direction, not level.
Two readings survive the definitional mismatch. First, the distribution-type names with data earn single digits to about 10% (Meril India’s distribution arm 10.4%, Vasa Denticity 6.1%), and that thin margin has to fund inventory and receivables. Second, SMT at 14.1% sits far below the 27.1% global median even though it makes stents, so in my reading it is scale and product mix, not an Indian cost advantage, that sets a maker’s margin.
The largest spread has no audited margin attached to it. A Maharashtra price-monitoring survey of inpatient consumables found a standard IV infusion set bought at Rs 11.05 and billed at an MRP of Rs 325 (a 2,841% mark-up), a 10 ml syringe at Rs 6.75 against Rs 57.20 (747%) and a disposable mask at 153%. The industry body AiMeD cites cardiac catheters landed at Rs 1,500 to 2,000 against MRPs of Rs 7,000 to 11,000. That spread is why policy attention is moving to the channel: on 18 September the health minister asked the Department of Pharmaceuticals to evaluate trade-margin rationalisation, and a parliamentary committee suggested capping the landing-price-to-MRP gap at 20% (the article does not print the year, so I infer 2026). Precedents exist: stent and knee-implant price caps in 2017 and a 70% trade-margin cap on five device types in July 2021.
My inference, not a policy fact: if a cap is set at the first point of sale, the squeeze lands on importers, distributors and hospital billing, and a manufacturer selling at ex-factory prices is hit less directly. The second-order effect is the one to watch. A lower MRP ceiling removes the room that lets a hospital absorb a tender discount, so price pressure can travel back to the maker at the next tender, and makers of commodity consumables would feel it before makers of differentiated implants.
Sources: Mercer Capital (global median, data to 31 Mar 2026), Medtronic FY26 release, CARE Ratings on Meril Life Sciences India, Medical Buyer on the mark-up survey, Business Today, Apr 2026, IPO Watch on SMT, Poly Medicure Q1 FY27 slides, and Screener.in company pages (23 Oct 2026) for the listed names.
What will drive the next phase of growth
The next phase is driven more by import substitution, product-mix upgrades and exports than by the market simply getting bigger, which matters because published market-size forecasts imply growth anywhere from about 6% to about 27% a year.
| Driver | Evidence | Which products it lifts | Listed beneficiary | What can stall it |
|---|---|---|---|---|
| Hospital capacity build | About 38,000 private beds planned by 2030; Apollo about Rs 8,000 cr and Narayana Rs 3,000 cr of capex | Consumables per bed: infusion, blood, surgical; then equipment | Poly, Hemant, Apollo as the gauge | Pricing controls and cost pressure at hospital operators |
| Tier II-III and insurance reach | Demand growth of 16-18% against 12-14% in metros; over 70% of Ayushman hospitals sit outside metros | Lower-cost Indian products over imported ones | Poly, Hemant | Tender L1 pricing favours subsidised imports |
| Import substitution | Domestic share of local demand rose from about 10% to about 30% in five years; Indian Class-C devices 10-40% cheaper; locally made stents and knee implants described as 25-30% cheaper | Stents, ortho implants, dialysers, imaging consumables | SMT, Poly (cardiology, renal) | Component dependence: SMT imports 77% of purchases |
| Product-mix upgrade | Poly’s cardiology registry (PACIFER DES) has enrolled 840 of 2,000 patients; SMT’s structural heart rose from 12.3% to 16.7% of revenue in two years | Higher-margin cardiology, structural heart, ortho | SMT, Poly | Clinical and regulatory lead time: SMT’s other products rely on older EU certificates valid to 31 Dec 2027 |
| Exports and acquisitions | Exports about $4 billion against a $20 billion FY30 aim; Poly’s Europe sales grew 43.8% in Q1 FY27 (17.6% organic) after Citieffe and PendraCare; SMT earns 74% of revenue abroad | Cannulas, infusion, stents, trauma implants | Poly, SMT | US tariffs, EU certification, integration cost |
| Policy support | PLI: 5% incentive on incremental sales for a five-year performance period (FY23 to FY27) across 55 devices; medical device parks with shared testing and sterilisation | Whatever qualifies; mostly high-end devices | PLI recipients | Scheme ends FY27; disbursements so far are small against Rs 3,420 cr |
| Management targets | Poly’s Vision 2030 doubles FY26 revenue (Rs 1,875 cr) by FY30, about 19% a year; FY27 guide Rs 2,300-2,400 cr | Whole portfolio | Poly | Q2-Q4 FY27 must average about Rs 592 cr a quarter against Rs 525 cr in Q1 |
Sources: IBEF, BusinessToday on hospital capex, India Briefing on PLI, SMT summary, Business Today, Aug 2026, Poly Medicure Q1 FY27 slides, Poly Medicure Q1 FY27 call (10 Aug 2026).
Three things follow. First, growth converts to profit only where the product has moved up the value ladder: Poly’s FY26 sales grew 12% but net profit fell 5%, and four of the original five proxies had lower profit on higher sales. Second, the fastest-growing lines (cardiology, structural heart, trauma) are the ones with the longest approval and clinical lead times, so growth arrives in steps tied to certifications rather than smoothly. Third, a market growing 15% to 20% with import substitution adds roughly 1.5 to 2 times that rate to a domestic maker’s addressable share, but only until local share reaches the ceiling set by the components India cannot yet make.
Indian versus global players
Indian makers compete on cost, regulated-market exports and bought capability in mid-complexity categories rather than on frontier technology, so the comparison with global leaders is best made category by category, not company against company.
| Dimension | Global leaders | Indian players | What it means |
|---|---|---|---|
| Scale | Medtronic FY26 revenue $36.4 billion; global market about $572 billion | Poly Medicure FY26 Rs 1,875 cr; SMT Rs 1,219 cr; Tarsons Rs 423 cr | Largest listed Indian maker is roughly 1/165th of Medtronic (at an illustrative Rs 85 per dollar) |
| Gross and EBITDA margin | Global device median 67.4% and 27.1% | Poly consolidated 73.4% and 24.1% | Unit economics are comparable; Poly’s EBITDA is lower on scale and acquisition costs |
| Growth | Median revenue growth 12.2%; Medtronic guides 6.75% to 7.25% organic | Poly Q1 FY27 organic +12.4%; FY27 guide implies about +25% reported | The Indian leader outgrows mature bases, partly through acquisitions |
| Pricing power | Innovation-led; Medtronic non-GAAP operating margin fell 130 bps in FY26 (tariffs 50 bps) | Strong in differentiated lines, weak in commodity lines (Poly renal sales -3.8% on Chinese pricing) | The moat depends on the product category, not on geography |
| Regulation and tariffs | Medtronic guided an FY27 tariff hit of about $250 million (one source) | Domestic price-control risk plus export tariff risk | Indian names carry both exposures |
| Innovation capacity | Device R&D about 7.3% of revenue (Mercer median) | Poly R&D 1.59% of sales; not sourced for other listed names | Likely gap; check filings before assuming parity |
| Depth and components | Full portfolios across imaging, cardiology, neurology and orthopaedics | About 20% of advanced Class-C devices made locally; imaging mostly imported; SMT imports 77% of purchases | Headroom sits in high-end categories and in the components behind them |
| Valuation | Global device median 13.7x EV/EBITDA | Poly 25.8x EV/EBITDA on Screener’s definition | Indian scarcity is priced at roughly twice the global multiple |
Sources: Screener.in and the Poly Medicure Q1 FY27 slides; Mercer Capital (global medians, data to 31 Mar 2026); Medtronic FY26 release; iData Research on tariffs. Cross-currency comparisons use an illustrative Rs 85 per dollar and are orders of magnitude, not precise ratios.
The Indian edge is real but narrow. Single-use consumables (infusion sets, cannulas, syringes, blood bags) are high-volume, process-driven products where Indian cost levels and export approvals matter more than invention, and Indian Class-C devices are priced 10% to 40% below imports. That is where Poly built its position. The edge fades as the product gets harder: the advanced devices India makes locally are about a fifth of its Class-C demand, imaging is mostly imported, and a 1.6% R&D budget cannot fund a frontier pipeline. Buying capability is the shortcut Poly has taken, with PendraCare (Netherlands, interventional cardiology catheters, EUR 18.8 million for 90%) and Citieffe (Italy, trauma implants, about EUR 31 million) in 2025.
Second-order read: the global leaders are not the only competitors. Chinese makers set the price in commodity lines (Poly’s renal sales fell 3.8% on Chinese pricing), and unlisted Indian champions such as Meril compete in the same mid-complexity categories where SMT and Poly are trying to move up. So an Indian listed maker’s real contest is a price war at the bottom and a certification race at the top, and the valuation premium of about two times the global multiple pays for winning the second while surviving the first.
Listed proxies to track
Poly Medicure is the only scaled, liquid listed pure-play; every other name is a small cap, an SME listing or a mixed-model company, and trailing P/Es run from 22x to 135x.
| Company | What it makes or sells | Mcap (Rs cr) | P/E | EV/EBITDA | ROCE % | FY26 sales / PAT (Rs cr) | Promoter % | What to watch |
|---|---|---|---|---|---|---|---|---|
| Poly Medicure | Infusion sets, blood bags, renal, cardiology, ortho; 69% of revenue outside India | 14,637 | 45.7 | 25.8 | 12.5 | 1,875 / 321 | 62.4 | Margin recovery to 24-25%, debtor and inventory days, renal pricing |
| Molbio Diagnostics | Truenat molecular diagnostics (point-of-care PCR) | 14,279 | 57.2 | 43.6 | 18.5 | 1,446 / 164 | 41.3 | Growth beyond the testing cycle, debtor days 103 |
| SMT (Sahajanand Medical) | Drug-eluting stents, TAVI, structural heart; listed 23 Oct 2026 | 3,839 | 58.6 | 22.9 | 11.4 | 1,210 / 69 | 36.2 | First listed-company results, 14% EBITDA margin |
| Fischer Medical | MRI systems (AMTZ, Vizag) | 1,738 | 71.0 | 35.6 | 11.4 | 308 / 31 | 63.1 | Debtor days 342, operating cash flow negative |
| Tarsons | Plastic labware (not a device maker) | 1,596 | 135.0 | 13.4 | 4.6 | 423 / 14 | 47.3 | Profit down from Rs 101 cr (FY22) to Rs 14 cr |
| Q-Line Biotech (SME) | Diagnostic kits | 1,235 | 21.8 | 13.3 | 22.4 | 342 / 56 | 67.5 | Cheapest P/E but debt-to-equity 0.92, debtor days 134 |
| Laxmi Dental | Dental aligners and prosthetics | 937 | 26.9 | 17.1 | 15.0 | 278 / 29 | 41.8 | Working-capital days jumped 73 to 182 |
| Hemant Surgical (SME) | Surgical and hospital consumables | 829 | 49.1 | 29.2 | 19.2 | 232 / 18 | 52.8 | Promoter stake down 20.7 points in three years |
| Vasa Denticity (SME) | Dental distribution (Dentalkart) | 787 | 67.9 | 45.0 | 7.0 | 277 / 10 | 59.7 | Operating cash flow negative three years running |
| Apollo Hospitals | Demand gauge: hospitals | 1,11,358 | 52.9 | n/a | 17.4 | 25,228 / 2,003 | n/a | Bed additions and procurement tone |
Source: Screener.in company pages (consolidated, 23 Oct 2026 close), copied as displayed. Molbio’s own page shows P/E 57.2; other pages’ peer tables showed 65.8. SMT’s Screener sales of Rs 1,210 cr differ from Rs 1,219 cr in its IPO notes. Screener’s EV/EBITDA includes other income. Prevest Denpro returned a 404 and is dropped; Shree Pacetronix and Centennial Surgical were not checked; Meril and Healthium are unlisted.
How to use the list:
- Bellwether: Poly Medicure tells you whether Indian consumables makers can grow revenue and hold margin at the same time.
- Import-substitution test: SMT is the first listed stent and structural-heart maker; its first results show whether a 14% margin business deserves a 59x multiple.
- Demand check: Apollo’s bed additions drive consumable volumes for the whole set.
- Cautionary tale: Tarsons shows what happens when revenue stalls and depreciation and debt stay: profit fell about 86% in four years.
Key risks and threats to the story
The most probable source of near-term losses is not demand but price: a trade-margin cap, Chinese dumping, a tariff, or a de-rating of premium multiples; the structural risk is that India stays an assembler of imported components.
| Risk | Evidence | Most exposed | Likelihood / impact (my judgement) |
|---|---|---|---|
| Trade-margin or price caps | Health minister asked the Department of Pharmaceuticals on 18 Sep 2026 to evaluate trade-margin rationalisation; a parliamentary panel suggests a 20% cap on the landing-price-to-MRP gap; the ministry said in April no formal proposal exists (Medical Buyer, Business Today). Precedents: 2017 stent and knee caps, 70% trade-margin cap on five device types in July 2021. | Importers, distributors and hospital billing first; manufacturers if the cap reaches ex-factory prices | Medium-high / High |
| Chinese and ASEAN dumping | Poly’s renal revenue fell 3.8% in Q1 FY27 on Chinese pricing; dialyser imports doubled to Rs 256 cr in two years; an anti-dumping probe on dialysers is open | Commodity consumables: renal, syringes | High / Medium |
| US tariffs | Section 232 probe on medical goods opened Sep 2025, no determination as of a Sep 2026 review; 100% Section 301 duty on Chinese syringes and needles (iData, MedTech Dive) | Exporters with US revenue (Citieffe is 48.3% US; Poly’s group US share is not disclosed) | Medium / Medium |
| Thin component base | Local content is about 30%; imaging value-add is 40-50% because X-ray tubes and detectors are imported; assembly captures only 30-40% of product value (Business Today, GrowthJockey) | High-end device assemblers | High / Medium over years |
| Inverted duty and GST | Most devices carry 5% GST while many inputs and job-work services carry 18%, which locks up working capital (Poly management, per Business Today) | Every manufacturer; Poly’s 335-day cash cycle is one symptom | High / Medium |
| Acquisition integration and cost inflation | Poly consolidated EBITDA margin 24.1% against 26.7% a year ago; Haryana minimum wage up 35%; Poly employee cost up 28.5% | Poly | High / Medium |
| Working-capital stretch | Poly debtor days 76 to 103 and inventory days 323 in FY26; Laxmi working-capital days 73 to 182; Vasa’s operating cash flow negative three years | Mid and small caps | Medium / Medium |
| PLI sunset | Scheme runs to FY27 with a 5% incentive on incremental sales for a five-year performance period; 28 of 77 applications approved; disbursement figures conflict across sources | PLI beneficiaries with thin margins | Medium / Low-medium |
| De-rating and ownership churn | Poly’s foreign holding fell from 12.3% to 5.4% in seven quarters; Laxmi’s stock is down 41% in a year; Hemant’s promoter down 20.7 points | Every premium-multiple name | Medium-high / High |
Source: Screener.in, the sources linked above and the Poly Medicure Q1 FY27 call (10 Aug 2026). Likelihood and impact are my judgement, not measured probabilities.
Valuations: what’s priced in, and what isn’t
At Rs 1,444 Poly Medicure’s price already pays for Vision 2030 and a premium multiple that lasts, while it gives little visible credit for the channel-margin, tariff and dumping risks; the smaller proxies need margins well above today’s to justify their prices.
A reverse DCF solves for what each price needs (growth, margin or discount rate) without producing a fair value. A return-hurdle grid asks what earnings growth and exit multiple a target return needs. Peer multiples show where each stock sits against the group and the global median. A sum of the parts for Poly Medicure prices its segments separately. Every forward number is my assumption and is marked (E).
What the price of each proxy needs
Each row holds the stylised reverse DCF to the same shape: revenue compounds at a constant 15% or 20% for ten years, the margin stays constant, tax is 25%, cost of capital runs from 12.5% (Poly) to 14.5% (smallest names) by size, terminal growth is 5.5%, and reinvestment equals D&A plus half of incremental revenue plus working capital of 22% of incremental revenue. The bar is the margin that makes the discounted cash flows equal today’s enterprise value. It tests plausibility; it does not forecast.
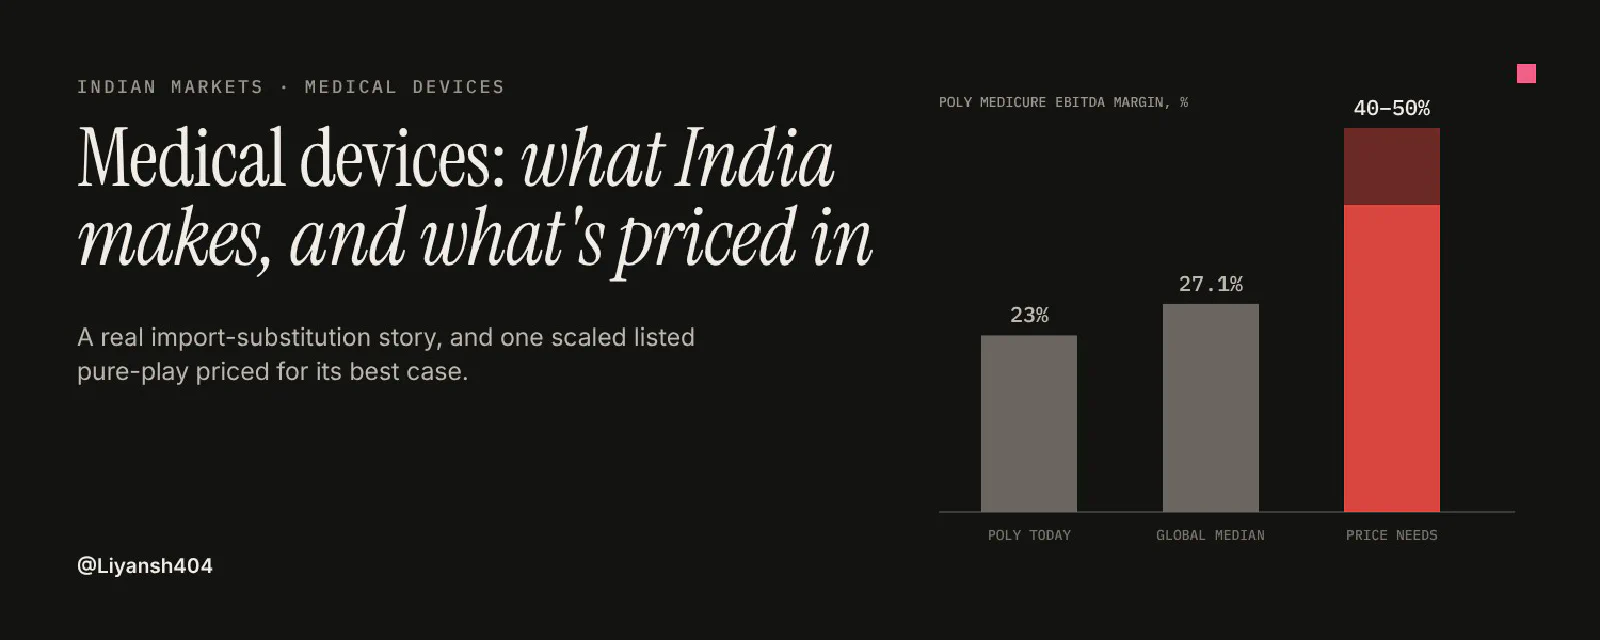
Poly needs 40% to 50% against 23% earned, and the global device median is 27.1%, so the price needs a margin that few device makers anywhere earn. Tarsons and Molbio need even more, and Tarsons’ depreciation of 24% of sales is a large part of why. Only Q-Line Biotech sits within a few points of its required margin, and it is a small SME-listed name with thin data. The stocks that look cheapest on EV/Sales (Vasa, Laxmi, SMT) are not cheap on this test, because their current margins are far below what the price needs.
| Company | Enterprise value (Rs cr) | Revenue base (Rs cr) | EV / sales | EV / EBITDA (operating profit) |
|---|---|---|---|---|
| Poly Medicure | 14,902 | 1,997 (TTM) | 7.5x | 32.3x |
| Molbio Diagnostics | 14,362 | 1,754 (TTM) | 8.2x | 32.9x |
| SMT (stents) | 4,112 | 1,210 (FY26) | 3.4x | 24.0x |
| Tarsons | 1,964 | 441 (TTM) | 4.5x | 16.5x |
| Laxmi Dental | 940 | 287 (TTM) | 3.3x | 20.4x |
| Q-Line Biotech | 1,384 | 342 (FY26) | 4.0x | 14.1x |
| Hemant Surgical | 834 | 232 (FY26) | 3.6x | 34.8x |
| Vasa Denticity | 783 | 302 (TTM) | 2.6x | 60.2x |
Enterprise values are from Screener.in at the 23 Oct 2026 close; the EV/EBITDA column divides by operating profit before other income, so it reads higher than the Screener figures in the proxies table (25.8x for Poly), which include other income. The global device median is 13.7x EV/EBITDA (Mercer Capital, data to 31 Mar 2026). On the same operating-profit basis only Q-Line (14.1x) and Tarsons (16.5x) trade near that median, and both have weak earnings records, so the cheap multiple is not a free lunch.
What Rs 1,444 requires from Poly Medicure
Solving for one variable at a time and keeping the rest of my base case, the price asks for about twice the growth, or a discount rate far below the cost of capital, or a margin double today’s.
| Test (one variable solved, the rest at my base case) | What the price requires | Reference point |
|---|---|---|
| Revenue growth, FY26 to FY30 | 35.0% a year | My base case (E) 17.1%; Vision 2030, revenue doubling by FY30, is 18.9% |
| Revenue growth over ten years | 28.0% a year | My base case (E) 13.7% |
| Years of 20% growth before fading to 5.5% | About 17 years (31 years at 15%) | Vision 2030 is a four-year plan |
| Discount rate | 9.1% | My cost of capital 12.5%; the 7% risk-free rate I use |
| EBITDA margin, every year | About 48% | Guidance 23% to 25%; five-year average 24.8%; global median 27.1% |
The solve keeps ten explicit years (FY27E to FY36E), tax at 25%, capital intensity from fixed-asset turns of 1.3x to 1.5x, net cash of Rs 501 cr (Rs 855 cr of cash and investments from the Q1 FY27 call less Rs 354 cr of borrowings), 10.14 crore shares from Screener’s market cap and price, and terminal growth of 5.5% at a 16% return on new capital. The 9.1% line is the cleanest way to read it: the price discounts Poly’s cash flows at barely two points above the 7% government bond rate, which is how a very safe compounder is priced, not a company with R&D at 1.6% of sales, 28% of revenue sold in India under price-control risk and renal lines under Chinese pricing pressure.
What a 12% return needs from earnings and the multiple
The table shows the price today that earns 12% a year for five years (before dividends), for a given annual EPS growth rate and exit P/E, starting from trailing EPS of Rs 31.09.
At Rs 1,444 the matching cell is about 16% EPS growth and a 40x exit multiple. My base case compounds EPS at 16.0% from FY26 to FY30E and Poly’s record since FY21 is 17.5%, so the growth is plausible; the 40x is the stretch, against a trailing P/E of 45.7x today and a global device median of 13.7x EV/EBITDA. To earn 12% a year at a lower 30x exit, EPS would have to compound about 22% a year; at a 25x exit it would need about 27%. Five turns of exit multiple and four points of annual EPS growth are each worth roughly Rs 180 to Rs 200 a share, and the multiple is the one management cannot influence.
Sum of the parts for Poly Medicure
Poly’s Q1 FY27 segment view is infusion 49%, orthopaedics 9%, renal 8% and cardiology 5%. The other 29% (blood management, surgery, anaesthesia and the rest) is not itemised in the figures I have, so I value it as other consumables. I apply that mix to FY27E revenue of Rs 2,300 cr, the bottom of the Rs 2,300 to 2,400 cr guidance. Margins and multiples are my assumptions, set against the 14x to 24x EV/EBITDA range of the larger Indian peers, Poly’s own forward multiple of about 27x at the current price, and the 13.7x global median.
| Segment | FY27E revenue (Rs cr) | EBITDA margin (E) | Basis | Multiple (E) | Value (Rs cr) |
|---|---|---|---|---|---|
| Infusion therapy | 1,127 | 25% | EV/EBITDA | 25x | 7,044 |
| Other consumables | 667 | 24% | EV/EBITDA | 25x | 4,002 |
| Renal | 184 | 20% | EV/EBITDA | 18x | 662 |
| Orthopaedics | 207 | 22% | EV/EBITDA | 20x | 911 |
| Cardiology | 115 | Early stage | EV/sales | 5x | 575 |
| Enterprise value | 2,300 | About 23.5% blended | 13,194 | ||
| Net cash | 501 | ||||
| Equity value | 13,695 | ||||
| Per share (10.14 crore shares) | Rs 1,351 |
The mid case is Rs 1,351 a share, 6% below the price. A low case (consumables 20x, renal 14x, orthopaedics 16x, cardiology 3.5x sales) gives Rs 1,084, and a high case (30x, 22x, 25x, 7x sales) gives Rs 1,629. The price sits inside that band but needs the consumables franchise to be worth about 25x forward EBITDA or more, in line with SMT’s 24.0x and well above Tarsons (16.5x) and Q-Line (14.1x). Cardiology adds Rs 575 cr, about Rs 57 a share or 4% of the price, so the market is paying for the existing infusion franchise, not for the pipeline.
What is priced in and what is not
| Theme | What the price assumes | What would change it |
|---|---|---|
| Growth | Revenue compounds well above Vision 2030’s 19% a year (35% to FY30 on the reverse DCF) | Q2 to Q4 FY27 must average about Rs 592 cr a quarter against Rs 525 cr in Q1 just to reach the Rs 2,300 cr floor |
| Margin | EBITDA margin holds at 23% to 25% while Citieffe and PendraCare are integrated | Q1 FY27 net profit fell 8.6% on 30% sales growth; watch the margin against 24% |
| Multiple | About 27x FY27E EBITDA (32x trailing on operating profit) against 13.7x globally and 14x to 24x for Indian peers | A growth slip tests the multiple first: five turns of exit P/E is worth about Rs 185 a share |
| Policy and trade | Little visible discount, in my read, for trade-margin caps, the undecided US Section 232 probe or the PLI scheme ending in FY27 | The DoP outcome on where a cap applies; a Section 232 determination |
| Renal and dumping | Management’s 15% to 18% renal growth for FY27 | Renal fell 3.8% in Q1 on Chinese pricing; an anti-dumping duty decision is expected around year-end |
| Pipeline | Small: the sum of the parts gives cardiology about Rs 57 a share | PACIFER DES registry (840 of 2,000 enrolled) and the orthopaedic ramp-up |
For the price to earn 12% a year, several things must hold together: revenue near my base-case Rs 3,528 cr by FY30, EBITDA margin at 24% or better, an exit multiple still near 40x P/E, channel rules that stop short of ex-factory prices, and renal pricing that stabilises. Miss any one and nothing in the price absorbs it. At my base-case EPS growth and a 30x exit, the price that earns 12% is Rs 1,112, about 23% below today. This is analysis of what the price implies, not a recommendation to buy or sell; I am not a licensed adviser.
What to watch
The thesis breaks on price rules and on Poly’s execution before it breaks on demand, so the watch-list is built around the levels at which I would change my view. The thresholds are my judgement, not published targets.
| Signal | Level that would change my view | Why it matters |
|---|---|---|
| Where a trade-margin cap applies | A cap set at ex-factory prices rather than at the first point of sale | It would move the squeeze from the channel to the makers (sector thesis) |
| Poly revenue, FY27 | Below Rs 2,300 cr (Q2 to Q4 must average about Rs 592 cr a quarter against Rs 525 cr in Q1) | The price needs growth well above Vision 2030’s 19% a year |
| Poly EBITDA margin | Below 22% for two consecutive quarters (guidance 23% to 25%; Q1 FY27 consolidated 24.1%) | Reverse DCF needs a far higher margin, so any slip widens the gap |
| Renal growth | Still negative after an anti-dumping duty decision (due around year-end) | Shows whether Chinese pricing is cyclical or structural |
| Exit multiple | Poly trades below about 30x trailing P/E on a flat EPS path | At 30x the 12%-return entry price is Rs 1,112, about 23% below today |
| Domestic share of local demand | Stalls near 30% for two years | The import-substitution runway is the sector case |
| Local content | Flat near 30% while imports keep rising | Assembly without component depth caps margins |
| SMT’s first results | EBITDA margin below its 14.1% IPO figure, or imports above 77% of purchases | Tests whether a stent maker deserves a premium multiple |
| Working capital | Poly debtor days above 103 or inventory days above 323 | Cash conversion decides whether profit becomes cash |
| US Section 232 | A determination that raises duties on medical goods | Poly’s international share is 72% of consolidated sales |
Prices, market caps and ratios are from Screener.in at the 23 Oct 2026 close; the analysis was written on 24 Oct 2026. Forward figures are my assumptions and marked (E). This is research and analysis, not investment advice, and I am not a licensed adviser.
Sources
- IBEF, Medical Devices Industry in India
- India Briefing, PLI progress and 2026 outlook
- Trade.gov, India medical devices market intelligence
- IMARC, India Medical Devices Market
- Fortune Business Insights, global medical devices market
- Medical Buyer, domestic disposables and import dependence
- Medical Buyer, Centre reviews hospital consumable pricing after 2,841% markup finding
- Business Today, patients overpaying for life-saving devices (Apr 2026)
- Business Today, private hospitals capex (Jul 2026)
- Business Today, why India’s device manufacturing has seen limited success (Aug 2026)
- Mercer Capital, Medtech and Device Value Focus (data to 31 Mar 2026)
- Medtronic FY26 results release
- iData Research, medical device tariffs in 2026
- MedTech Dive, Section 232 roundup
- Investing.com, Poly Medicure Q1 FY27 slides
- IPO Watch, Sahajanand Medical Technologies
- InCred Money, SMT summary
- CARE Ratings, Meril Life Sciences India (Oct 2024)
- Screener.in company pages for POLYMED, SMT, MOLBIO, FISCHER, QLINE, TARSONS, LAXMIDENTL, Hemant Surgical, Vasa Denticity and APOLLOHOSP; Tijori Finance for Poly’s revenue mix and R&D intensity; Poly Medicure Q1 FY27 earnings call, 10 Aug 2026.
Also used: HDFC Securities initiation on Poly Medicure (May 2023), Medikabazaar on infusion-set construction, HMD needle brochure, GrowthJockey on supply-chain tiers and import dependence, the Department of Pharmaceuticals task force on diagnostics, and press coverage of the 2017 knee-implant cap.
Data as of 23 Oct 2026 (Screener.in close). I do not hold any of the stocks named here. This is research, not a recommendation to buy or sell, and I am not a licensed adviser; do your own research.