Building assets isn't building value: what India's capex boom earns on each new rupee
28 of 46 asset-heavy Indian companies earned more than their cost of capital on the money they added. The fastest builders mostly didn't.
Over the last three years, Divi’s Labs and JSW Energy both built at speed. Divi’s paid for every rupee of its expansion from its own cash, and today earns 22% on its capital. JSW Energy tripled its borrowings, and its operating assets now earn about 10% on money that costs it 8.4%.
Same boom. Very different outcomes for shareholders.
India is in an asset-building cycle: hospital beds, hotel rooms, drug reactors, gigawatts of solar. The question that decides who creates value is simple: what does each new rupee of assets earn?
The argument in five lines
- Most of the boom is fine: 28 of 46 asset-heavy companies earned more than their cost of capital on the money they added.
- The fastest builders rarely do: of the 10 that grew assets 2.5x or more, only 3 cleared the bar.
- Hospitals look worst while they build and best once beds fill. Judge them on the J-curve, not this year’s ROCE.
- Solar is a fixed-price utility trading like a growth stock. The risk is the price, not the plant.
- The best signal is boring: did management do what it said last time?
The test: what does the new rupee earn?
I took every asset-heavy Indian company above ₹2,000 Cr that grew its fixed assets 30%+ between FY23 and FY26, and asked one question: how much extra operating profit did it earn on the extra capital it put in? That is incremental ROCE. The bar is about 13%, roughly India’s cost of capital after this month’s RBI rate hike.
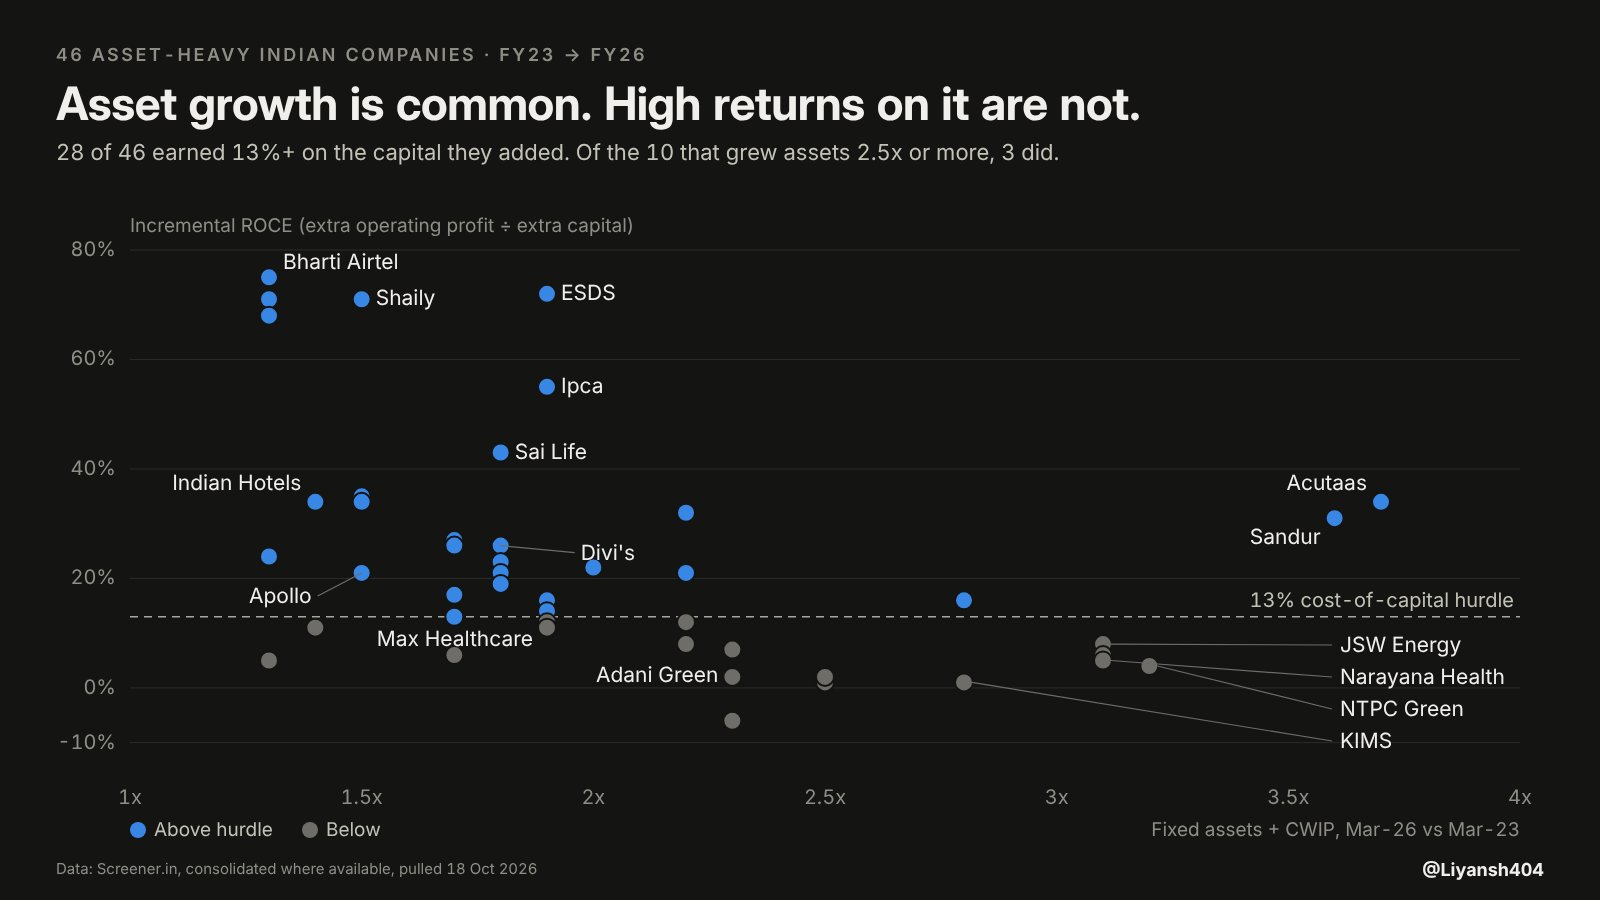
Good asset growth clusters in three places: pharma and CDMO plants (10 of 11 cleared the bar), hotels, and telecom. Even there, read the number carefully. Bharti Airtel’s 75% is mostly tariff hikes on a network it had already built, not returns on new assets.
Three builders that earn their keep
Divi’s Labs. Assets up 1.8x (₹4,935 Cr to ₹8,641 Cr) with zero debt. ROCE dipped to 16% in FY24 while new capacity ramped up, then climbed back to 22%. Custom synthesis, making molecules for innovator drug companies, is now 60% of revenue and grew 45% in Q1 FY27.
Indian Hotels. ROCE rose from 13% to 17% over FY23–FY26, with about ₹4,300 Cr of net cash. 93% of its 31,300-key pipeline is managed hotels: growth on other people’s capital.
Apollo Hospitals. Assets up 1.5x, earning 21% on the new capital. Established hospitals grew 18% in Q1 against 12–14% guidance, and losses at new hospitals stayed within budget.
The hospital bed that loses money first
A new greenfield bed costs about ₹1.5 Cr. It loses money in year one, breaks even around year two, and earns 25–30% once it fills. Measure a fast builder in years one to three and it looks broken, even when it isn’t. Capital still under construction earns nothing, and depreciation starts on day one.
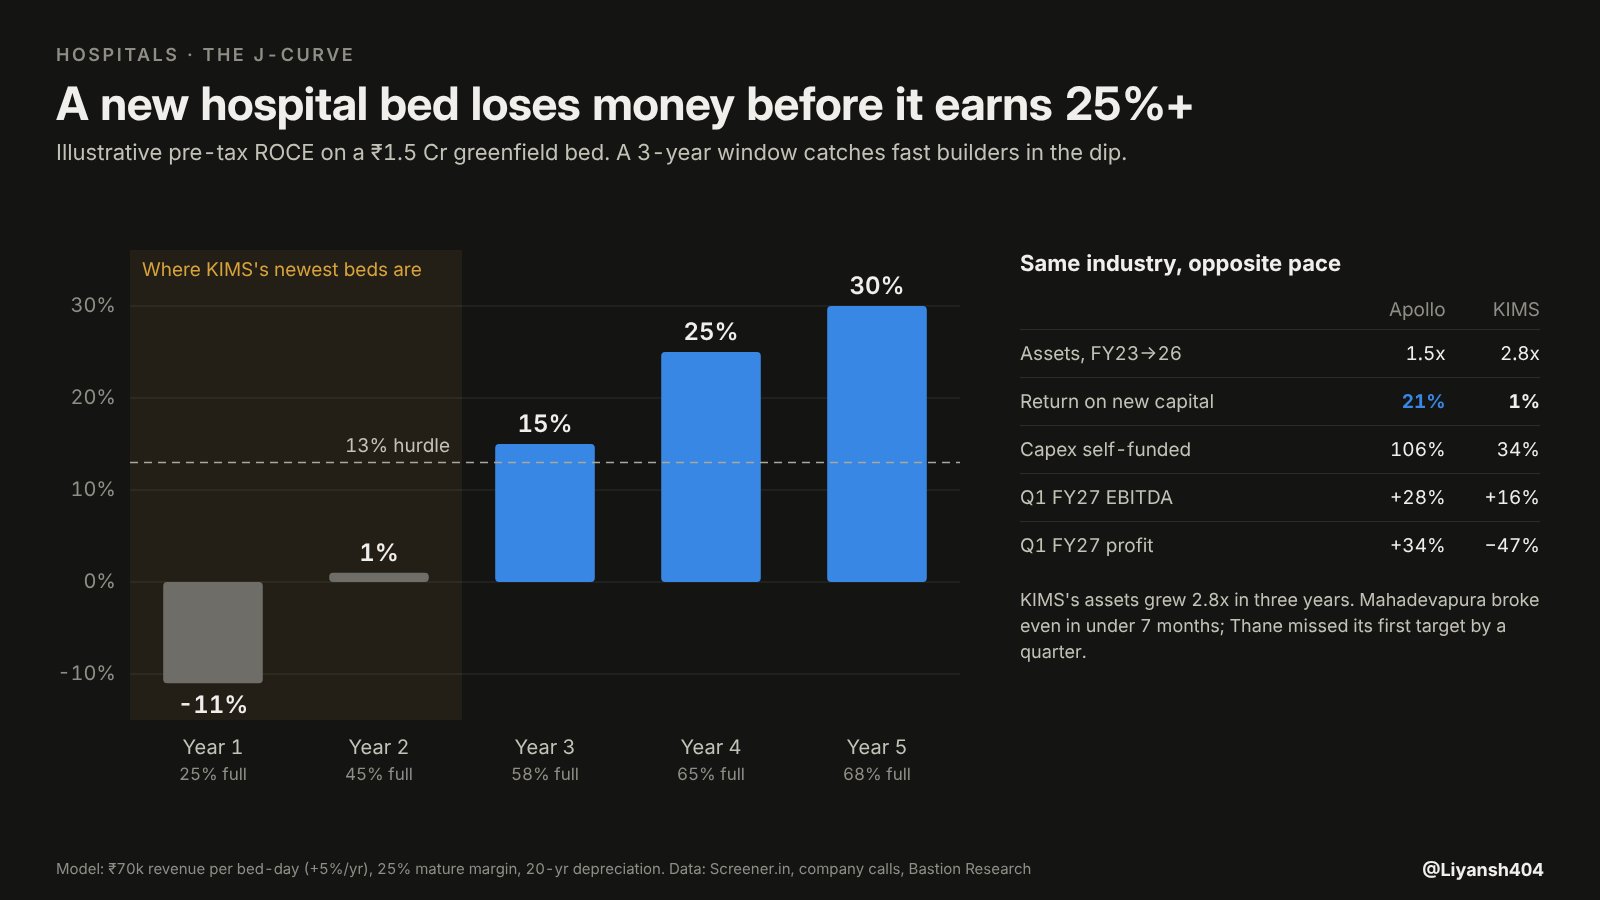
That is why Apollo and KIMS can sit in the same industry and look so different. KIMS’s assets grew 2.8x in three years. Its Mahadevapura hospital in Bengaluru broke even in under seven months. But Thane missed its first breakeven target by a quarter, management cut its occupancy and pricing targets, and at about 138x earnings the price already assumes a smooth ramp.
Narayana shows why you look inside the number. Its India hospitals’ margin rose to 24.8% in Q1 FY27. The drag is the UK business (8.8% margin) and a loss-making insurance arm.
Solar: a bond dressed as a growth stock
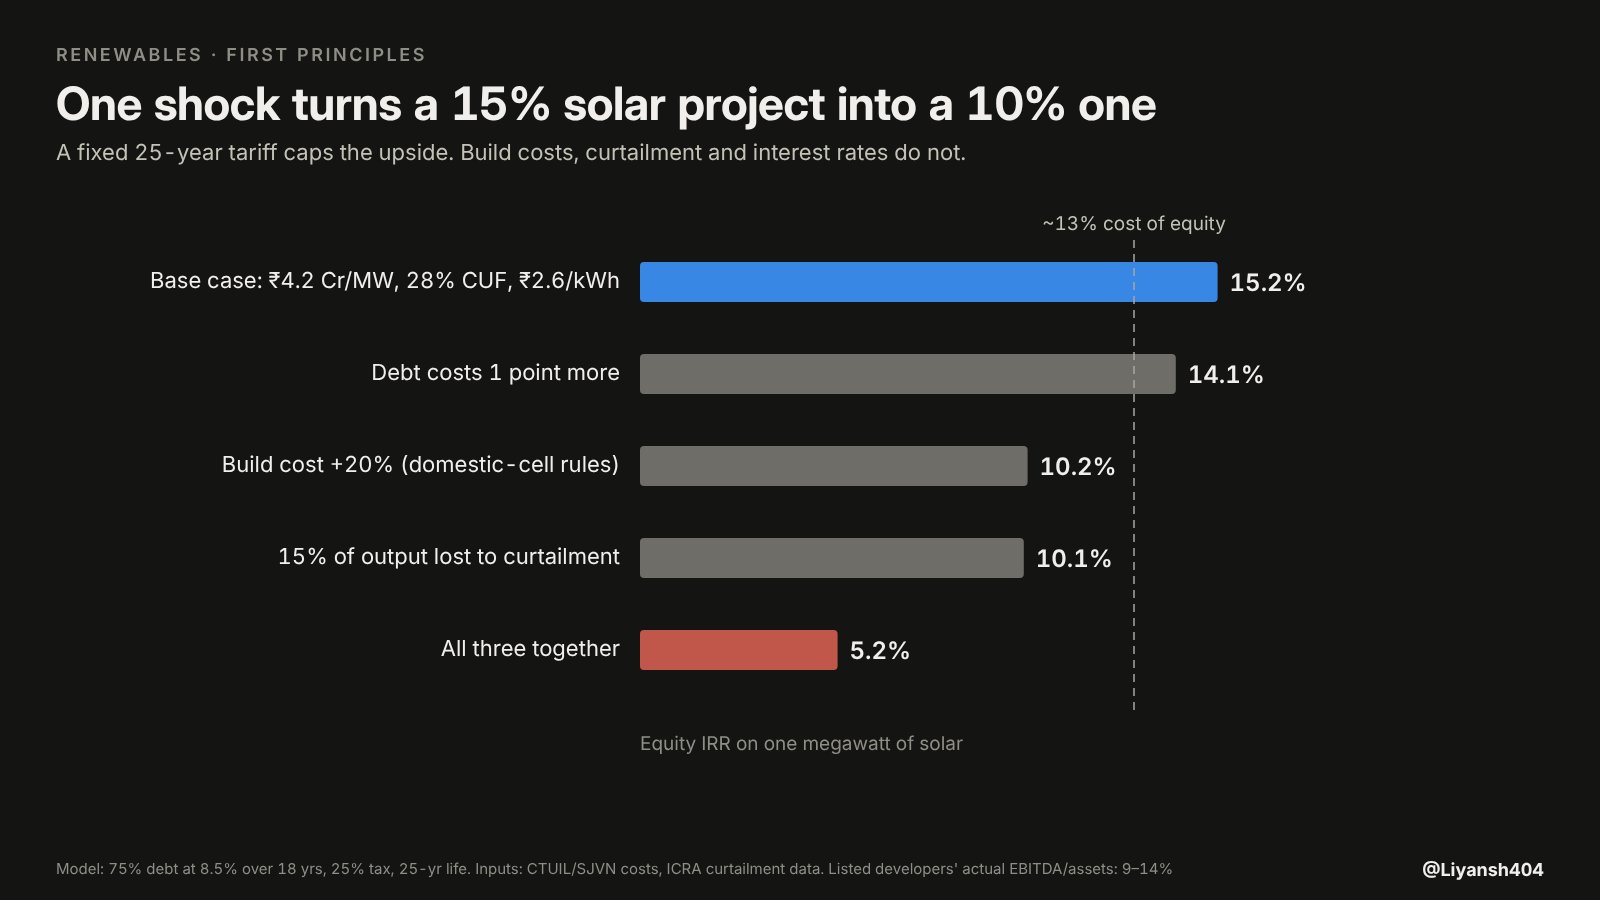
Start from one megawatt. It costs ₹3.5–5.5 Cr, runs about 28% of the time and sells power at about ₹2.6/kWh for 25 years. If everything goes right, that is roughly a 15% return on equity.
Build costs up 20% (from domestic-cell rules) or 15% of output lost to grid congestion each take it to about 10%. Add a one-point rise in debt costs, and all three together take it to about 5%.
The second-order effects matter more than the first:
- The contract is one-sided. The tariff is fixed for 25 years, so good news can’t raise revenue. Bad news flows straight to shareholders.
- Everyone building at once makes the bottlenecks dearer. ICRA says a third of 54.8 GW of recently commissioned capacity runs on temporary grid access, with 50–60% curtailment during solar hours in Rajasthan and Gujarat. New auction awards fell from 40.6 GW in FY25 to 4.7 GW so far in FY27.
- Value is moving to firm power. Storage-backed tenders clear at about ₹6/kWh, more than double plain solar.
Listed developers earn 9–14% EBITDA on their fixed assets, yet several trade at 96–125x earnings. The plants are fine. The price isn’t.
Where the trap is real
Back to JSW Energy. Its borrowings tripled to ₹76,946 Cr, profit covers interest just 1.3 times, and Q1 FY27 profit fell 37%. When new assets earn barely more than the debt that funds them, every delay lands on equity holders.
Most of the low-return corner of the chart is something else: timing (hospitals), price (solar), or one-offs like IndiGo’s fuel shock and Narayana’s UK deal.
Promises vs results
A balance sheet tells you what was built. Earnings calls tell you what was promised. I checked the promises made on earlier calls against Q1 FY27 (Apr–Jun 2026) results.
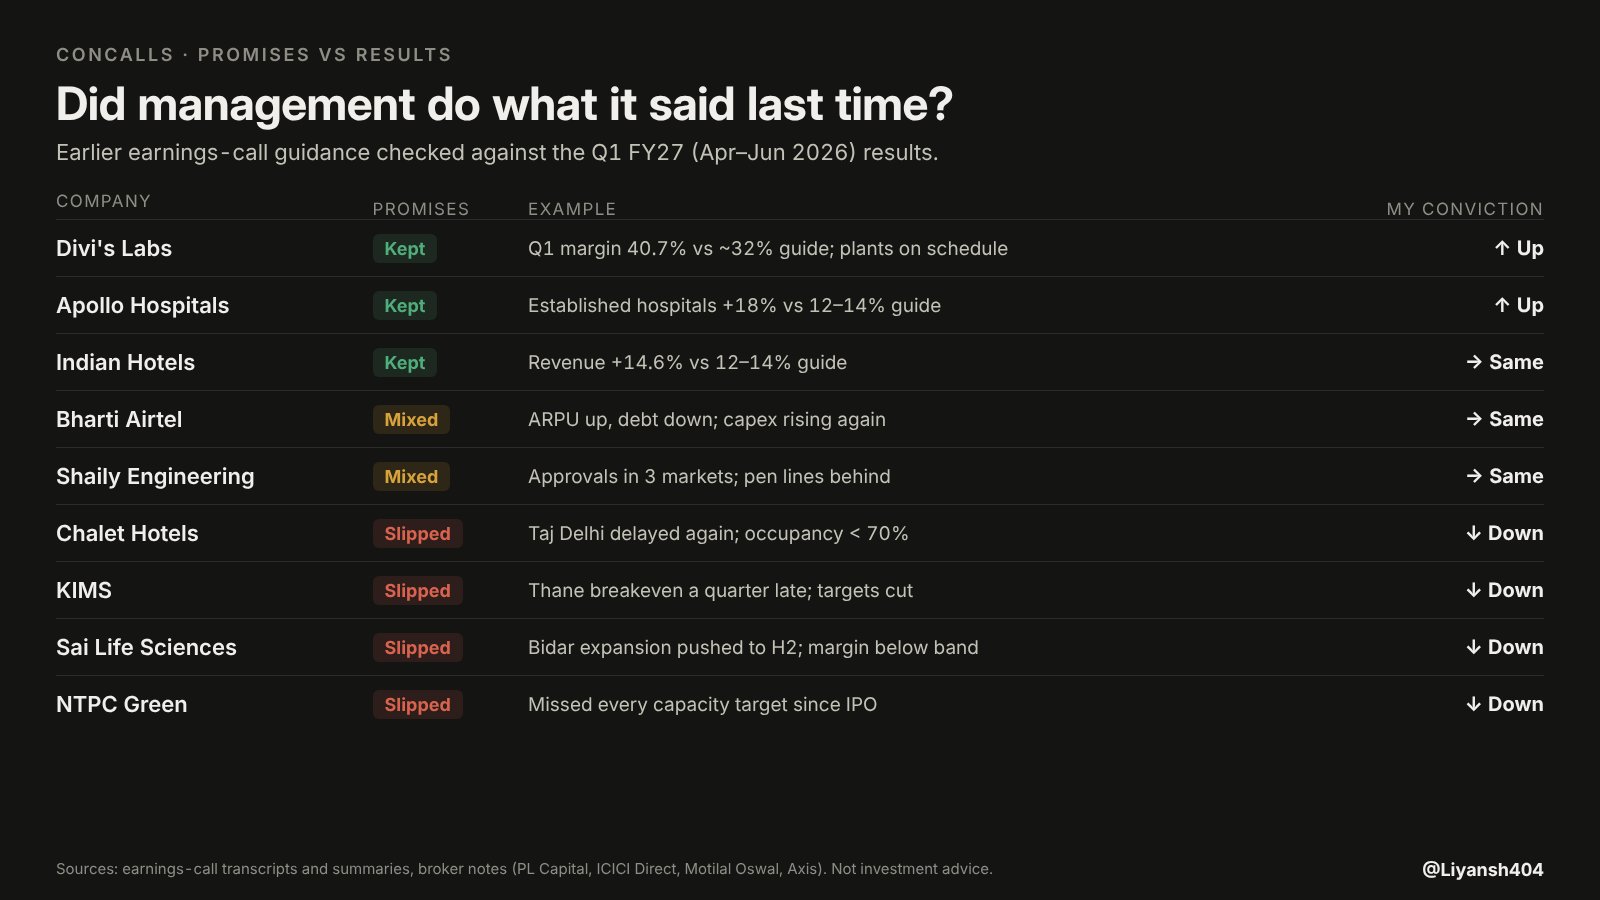
Divi’s, Apollo and Indian Hotels delivered or beat what they guided. Sai Life, Chalet, KIMS and NTPC Green slipped.
NTPC Green targeted 11 GW by FY26 at its IPO and reached 10.1 GW. It added 0.6 GW in Q1 against an FY27 target of about 8 GW. Sai Life’s Bidar expansion moved from June 2026 to the second half of FY27, while its capex is roughly six times what it was two years ago.
Old plants flatter, new plants tell the truth
Hospitals and chemical plants bought years ago earn 30–42% EBITDA on their book value. The same capacity costs far more to build today. As new assets join old ones, blended returns fall even when management does nothing wrong.
So a falling ROCE during a build-out isn’t automatically bad. But returns won’t go back to the old peak either. The useful question is: what does the new asset earn at today’s cost?
What I’m watching in Q2 FY27
- Divi’s: ₹2,113 Cr of capital under construction moving into service without diluting margins.
- Apollo vs KIMS: margins at new hospitals; Thane and Bengaluru breakeven.
- Indian Hotels: room-rate growth now that occupancy is high.
- Bharti Airtel: tariff hike timing, especially once Jio lists around 28 October.
- JSW Energy: interest cover after its equity raises.
Four questions for any capex story
- What does the finished asset earn?
- What would it cost to build today?
- Who funds it until it earns?
- Did management deliver what it promised last time?
A company that builds is not the same as a company that compounds. The difference is in the answers to those four questions.
Data: Screener.in (pulled 18 Oct 2026), company earnings calls, broker notes (PL Capital, ICICI Direct, Motilal Oswal, Axis), ICRA, Crisil, HVS Anarock, Horwath HTL and Ember. The solar and hospital models are simplified illustrations. Not investment advice; do your own research.
Disclosure: I hold shares of Divi’s Labs. This is not a recommendation to buy or sell.
Originally published on X.